DEEP LEARNING CAPSTONE · PARTS 1 TO 8
Before
optimization
One baseline and three depths, all trained on the same split with the same seed. Depth moved best validation accuracy by 0.76 points and widened the generalization gap by 17.75. The problem was never capacity.
One rule shapes everything: No CNN, no Conv2D, no pretrained weights, no transfer learning.
Every image must be flattened before it reaches the first layer, so 32 × 32 × 3 becomes 3,072 × 1. That single decision sets the ceiling for every experiment that follows.
The data and the splitParts 1 and 2
Split once, shared by every experiment
seed 42, indices committed to splits.npz(45000, 32, 32, 3)training images, pixels scaled to [0, 1](5000, 32, 32, 3)stratified, 500 per class, drives every decision(10000, 32, 32, 3)sealed until Part 16, opened exactly onceThe validation set is carved out of the training half only, stratified so every class contributes exactly 500 images. Nothing from the test set influences any architecture or hyperparameter decision.
Examples per class (Train vs Test)
Part 1 · Original Notebook Plot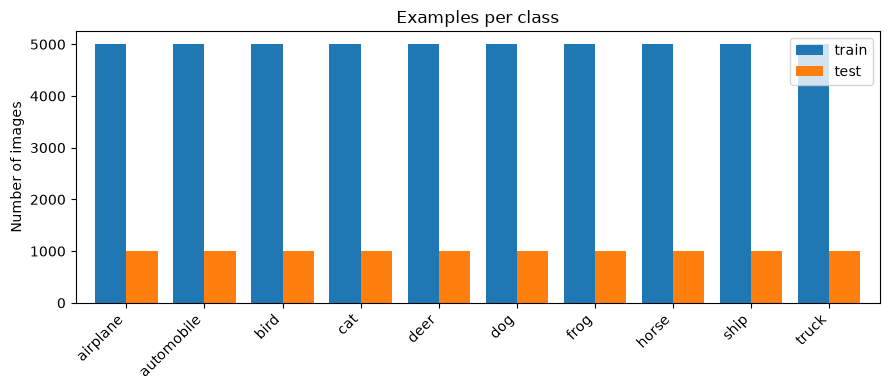
Raw pixel-intensity distribution (2,000 sample images)
Part 1 · Original Notebook Plot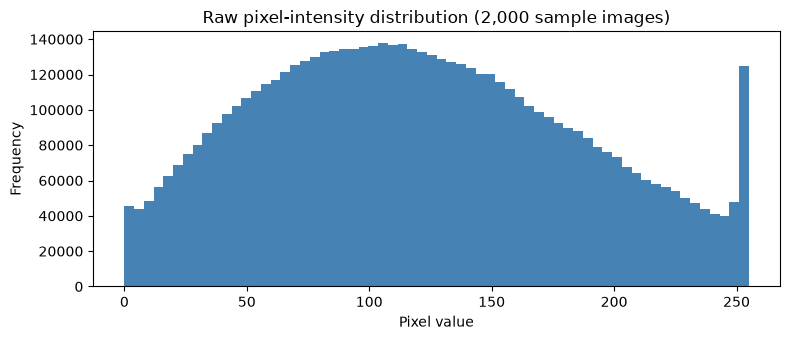
Normalized pixel-intensity distribution (2,000 sample images)
Part 2 · Original Notebook Plot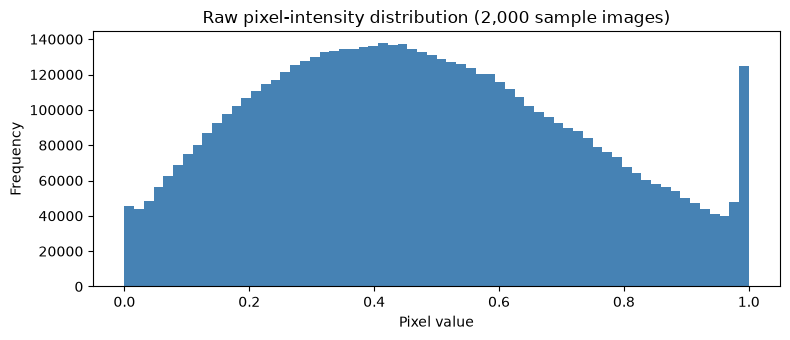
One example of each of the 10 classes
Part 1 · Original Notebook Plot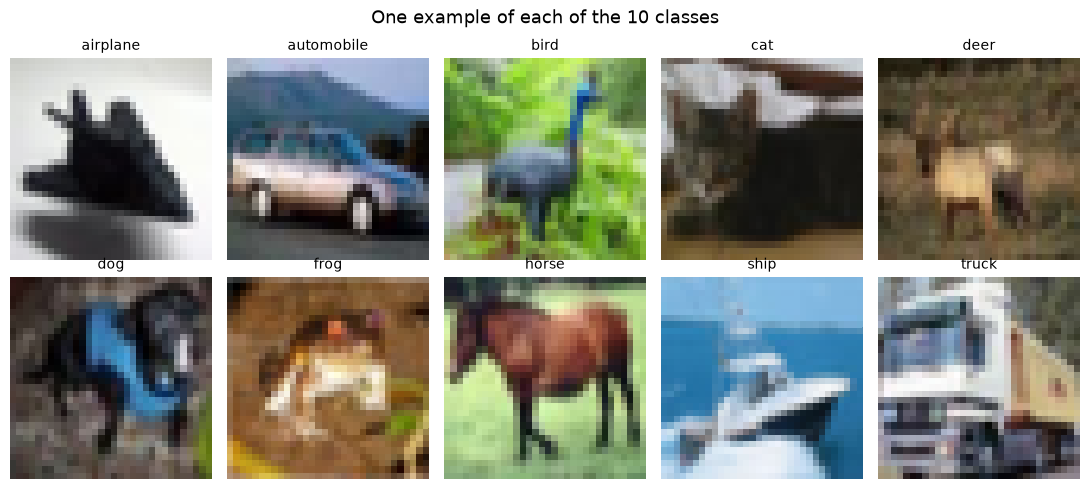
15 random training images
Part 1 · Original Notebook Plot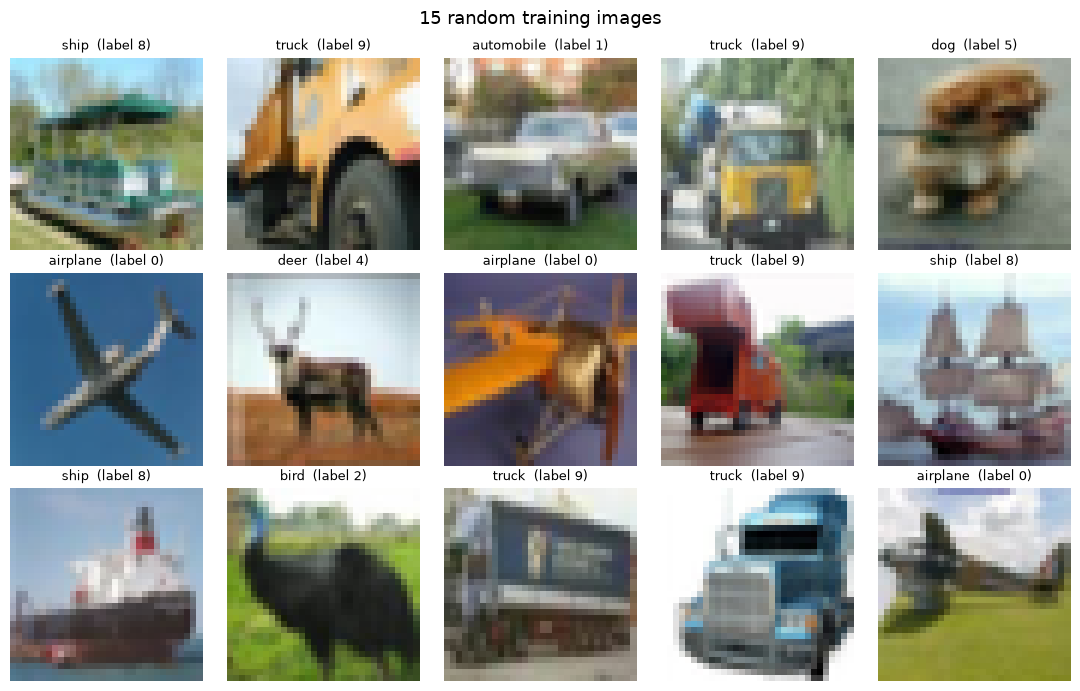
The baselinePart 3
1 hidden layer × 512 units
Best validation accuracy52.22%
Minimum validation loss1.3877
Final training accuracy67.46%
Trainable parameters1,578,506
OptimizerAdam @ 0.0001
Batch size / epochs128 / 50
About 5× the 10% random-guess floor, and 99.7% of those parameters sit in the very first layer, between the 3,072 inputs and the 512 hidden units.
Why these hyperparameters
512 neurons
Chosen by testing. At 32 units the model stalled at 19% accuracy with 31 of 32 hidden units dead. ReLU had collapsed the layer to a single effective neuron. 512 keeps the first hidden layer wide enough that it compresses the 3,072-value input only six-fold.
Learning rate 0.0001
The value the Part 9 sweep selects, adopted up front so every architecture comparison runs at the same setting the tuned model uses.
Batch size 128
Above the range swept in Part 10. At 45,000 training images it gives 352 weight updates per epoch.
50 epochs
Validation loss reaches its minimum near epoch 42. Extending to 100 epochs gained 0.4 points of validation accuracy while training accuracy gained 1.1. That is memorisation, not learning.
Baseline - 1 hidden layer, 128 units
Part 3 · Original Notebook Plot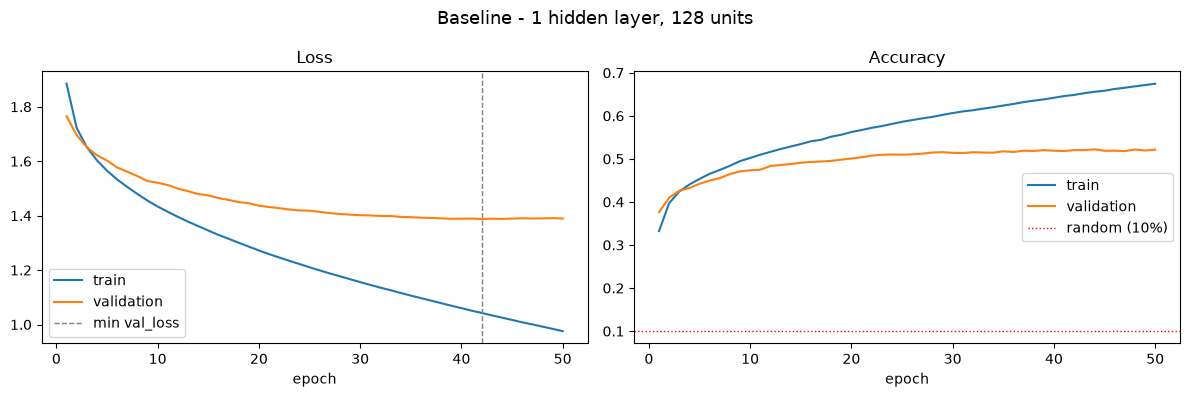
Three depths, one widthParts 4 to 7, same data and seed, only depth changes
Shallow
1 × 512- Best val accuracy
- 52.22%
- Gap
- 0.1524
- Final train accuracy
- 67.46%
- Parameters
- 1,578,506
Underfitting. Validation loss never meaningfully rises: it ends at 1.3896 against a minimum of 1.3877. Not memorising, just too small.
Medium
3 × 512- Best val accuracy
- 52.40%
- Gap
- 0.2959
- Final train accuracy
- 81.99%
- Parameters
- 2,103,818
Good fit for 13 epochs, then overfitting. Validation loss bottoms at 1.4024 and rises 27% to 1.7835 while training loss keeps falling.
Deep
5 × 512- Best val accuracy
- 52.98%
- Gap
- 0.3299
- Final train accuracy
- 85.97%
- Parameters
- 2,629,130
Strongest overfitting. Validation loss bottoms at epoch 12 then rises 74% to 2.4324, the largest rise of the three, despite the highest training accuracy.
Gap here is final train accuracy minus best validation accuracy, the definition Parts 4 to 7 report. The regularization experiments in tab 02 use a different one, and it is labelled there.
Validation accuracy by depth
50 epochs, from Results/*.jsonValidation loss by depth
lower is better, and only shallow stays downValidation loss & accuracy - all architectures
Part 7 · Original Notebook Plot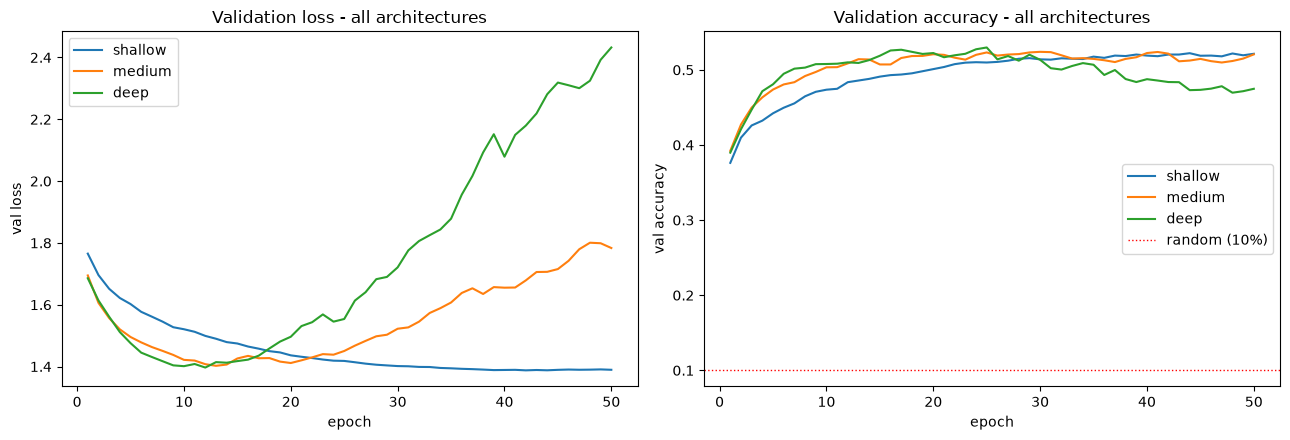
Depth bought overfitting, not accuracy. All three land within 38 images of each other on a 5,000-image validation set, where the standard error is about 0.7 points.
The diagnosisPart 8
Overfitting, beginning around epoch 13
Medium: 3 hidden layers of 512 neurons, 2,103,818 parameters
- Validation loss reaches its minimum of 1.4024 at epoch 13 and rises steadily afterwards: 1.402, 1.412, 1.522, 1.655 and 1.784 at epochs 13, 20, 30, 40 and 50.
- Training loss falls across all 50 epochs, from 1.845 to 0.542, and training accuracy climbs from 0.343 to 0.820.
- The gap widens from 0.0759 at epoch 13, the lowest-validation-loss epoch, to 0.2993 at epoch 50.
- Validation accuracy peaks at 0.5240 on epoch 30 and then falls back to 0.5206.
Not underfitting
The model reaches 0.820 training accuracy and its training loss is still falling at epoch 50, so it clearly has the capacity to keep fitting.
Not optimization instability
The curves are smooth: epoch-to-epoch validation loss varies by only 0.016, with a largest single jump of 0.089.
The fix carried into Part 15
Early Stopping on validation loss, with the best weights restored.
Medium: training against validation accuracy
the two curves separate and never rejoinMedium: training against validation loss
validation loss bottoms at epoch 13, then reversesMedium Baseline - Accuracy
Part 8 · Original Notebook Plot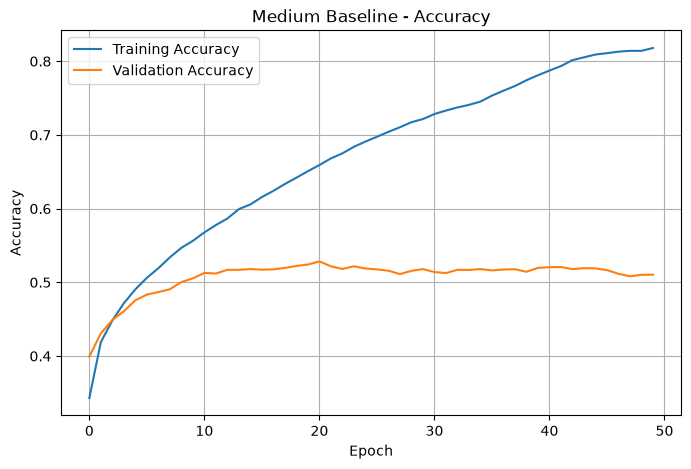
Medium Baseline - Loss
Part 8 · Original Notebook Plot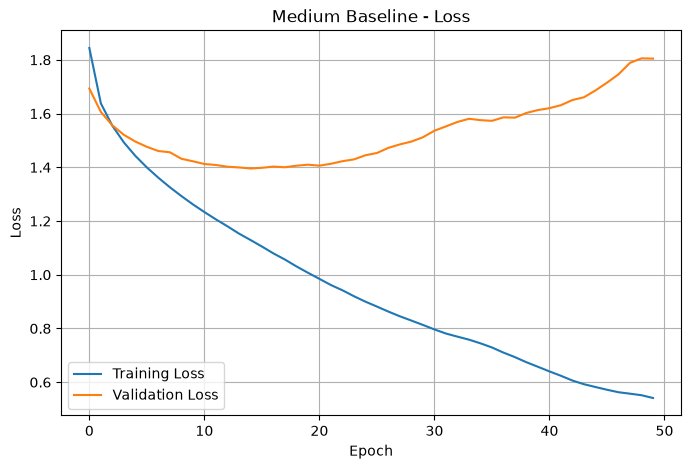
Training loss falls for all 50 epochs. Validation loss bottoms at epoch 13 and ends 27.2% higher. Everything after epoch 13 is memorisation.